New Dashboard Features: Custom Reports and Analytics
Our latest update adds customizable dashboards, automated client reports, and new metrics for tracking patrol completion, response times, and incident trends.
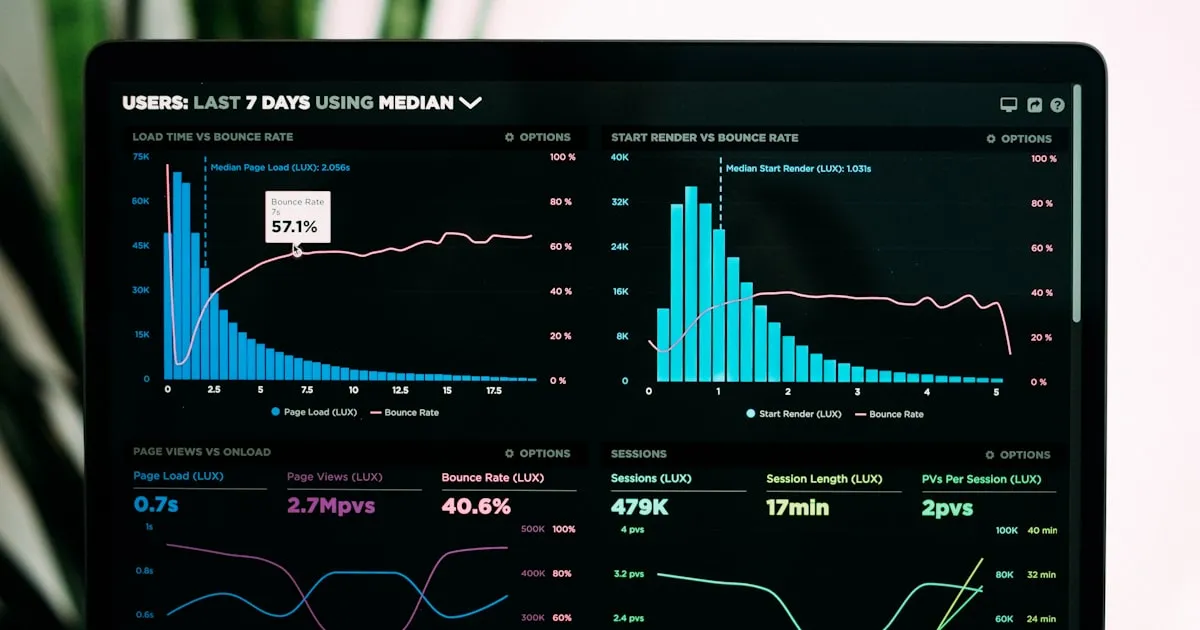
The number one question property managers ask: "How do I know your guards are actually doing their jobs?" Until now, answering that meant pulling data from three different screens and building a spreadsheet. The new analytics dashboard puts it all in one place.
New analytics dashboard with patrol completion tracking, response time metrics, incident trends, and one-click PDF reports you can hand to clients. Built to answer the questions that keep contracts alive.
Why This Matters for Contract Retention
Most security contracts don't get cancelled because of a single incident. They get cancelled because the property manager never sees proof the service is working. They pay $15,000 a month and have no idea if guards are completing patrols, responding to calls, or sitting in their car.
The analytics dashboard exists to make that proof automatic. Not as a surveillance tool for micromanaging guards—as a client communication tool that demonstrates value without anyone spending hours building reports.
What You Can Track
The dashboard breaks into four main areas, each answering a different operational question:
- Patrol completion rates — what percentage of scheduled checkpoints were scanned, by site and by officer. If Site A expects 12 checkpoints per shift and only 8 are getting scanned, you see that immediately.
- Response times — when an incident is reported, how long until a guard acknowledges it and how long until they arrive. Track this over time to spot trends.
- Incident trends — incident counts by type (medical, trespass, property damage), by location, by time of day, by day of week. Patterns become obvious when you can see three months of data on one chart.
- Officer activity — hours worked, checkpoints scanned, incidents responded to, reports submitted. Not to rank guards against each other—to spot when someone needs additional training or when a site is chronically understaffed.
Everything filters by date range, site, team, or individual. Pull up just Building C for the last 30 days, or compare all sites side-by-side.
Client Reports and the Portal
The real win is how fast you can put proof in front of a client. Pick a template, choose which metrics to include, and export a clean PDF—the same Daily Activity Report your guards already file, plus the dashboard charts. Build it once and reuse it; what took a Friday afternoon in Excel takes a couple of clicks.
For clients who want to see for themselves, the branded client portal shows them their sites only—live guards on the map, patrol proof, and incidents. They never see data from your other clients, and you don't have to send anything for them to check in.
Scheduled report delivery—generate and email on a recurring cadence with no one touching it—is on the roadmap. For now the workflow is export-and-send, and the portal covers the clients who'd rather look it up than wait for an email.
Data Export
All dashboard data exports to CSV. Use it for payroll reconciliation (compare hours tracked in TeamMap against your payroll system), for custom reports that go beyond our templates, or for feeding data into your accounting software.
Getting Started
The dashboard is live now for all plans. Start with patrol completion rates—that's the metric clients care about most. Export a PDF for your biggest client this week, or give them portal access and let them watch the patrols land in real time. Most companies find that proactive reporting changes the client relationship from "prove it" to "we trust you."
Key Takeaways
- Patrol completion, response times, and incident trends in one dashboard
- One-click PDF reports to hand clients, plus a branded portal for self-serve proof
- Filter everything by site, date range, team, or individual officer
- CSV export for payroll reconciliation and custom analysis
Continue Reading

Video Analytics for Security: Beyond Basic Surveillance
AI-powered video analytics can detect intrusions, count people, and identify anomalies. This guide covers practical applications and integration strategies.
Florida Security Guard License Application: Division of Licensing Guide
Navigate the Florida Division of Licensing application process for security guards, including background checks, training providers, and processing timelines.
The 10 Best Security Guard Management Software Solutions in 2026
From enterprise platforms to mobile-first apps, we review the top security guard software options. Honest assessments of features, pricing, and who each solution works best for.